
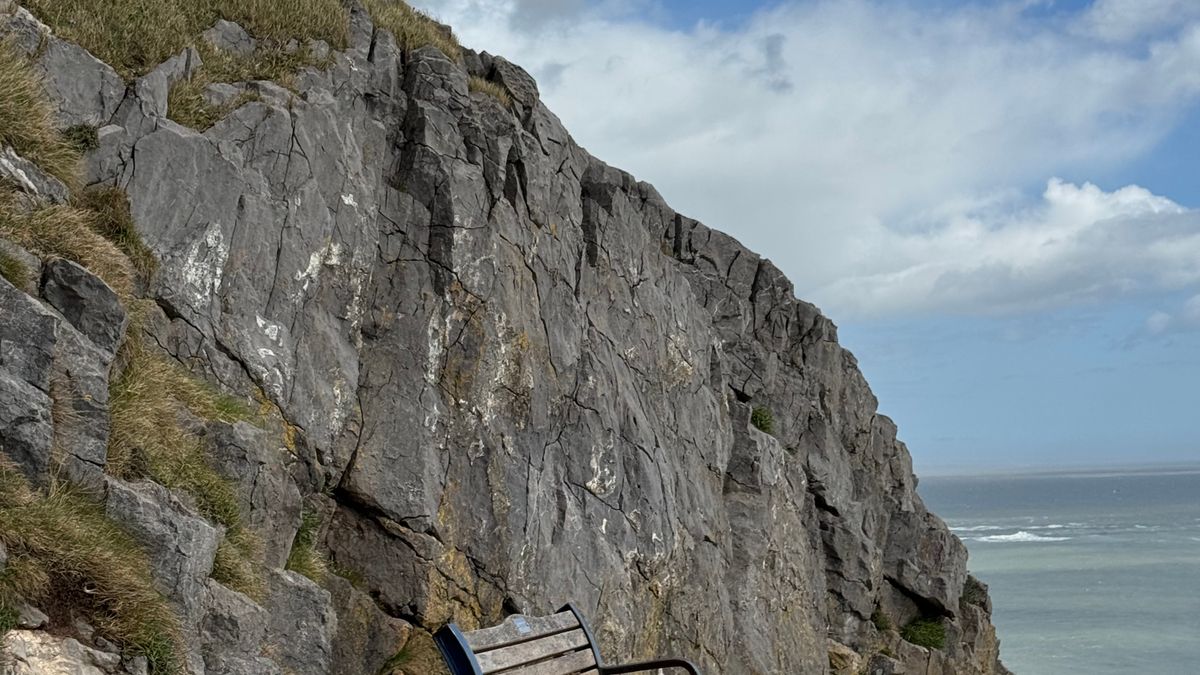
A harbour chart is never just a drawing of water. It is a snapshot of trade, tide and engineering all at once — soundings taken from a rowing boat, quay walls measured in feet, warehouses labelled by the cargo they held. Read one beside a modern survey and the coastline begins to move: mudflats become car parks, a stone quay retreats behind a concrete sea wall, an entire dock basin vanishes beneath a retail park. For anyone researching a coastal town, that movement is the story.
Start with your county record office or local studies library, and ask for the port's own records as well as the maps — harbour commission minute books, dues ledgers and engineer's drawings often survive in the same box.
Bring two or three dates together and look for these features in particular.
Older charts compress a great deal of information into a few marks, and the conventions reward a little patience.
You do not need expensive software to compare a chart with a modern survey. Scan the sheet at 600 dots per inch, then either georeference it in a free mapping package or print it and trace the quay line onto tracing paper laid over a current map. Anchor the overlay on features that have not moved: church towers, listed buildings, bridge piers, rock outcrops.
Work with at least three dates — often the 1840s, the 1890s and the 1950s — so you can see a trend rather than a single shift. Note both the survey date and any later corrections, because a chart printed in 1905 may show a harbour unchanged since 1872. Cross-check your findings against trade directories, harbour dues books and newspaper shipping columns, and keep a simple spreadsheet of features with grid references so your notes remain usable a year from now.
Take your overlay for a walk. Look for iron rings and bollards, granite kerbs, stone setts, blocked doorways and flight of steps that now end in a car park. Pubs and shopfronts named after maritime trades are often the last visible clue on a street that once faced the water.
Photograph what you find, record dates and grid references, and pass copies to your record office or local historic environment record. Stay on public ground, leave everything where it lies, and remember that much foreshore is protected and may hold archaeological remains — report anything unusual to the local finds liaison officer.
The reward is a coastline you can genuinely read: a working harbour layered beneath the promenade, the marina and the seaside car park, still legible to anyone willing to compare the old chart with the ground underfoot.

Hi, my name is Anthony kuber. I am artist and fashion designer.
I love to travel and writing blogging.
Your email address will not be published. Required fields are marked *
Software Developer & Writer
Hey, I'm Diva, a developer and writer blending code and creativity. I'm driven by a deep curiosity and a relentless pursuit of excellence. Join me as I craft digital solutions and captivating stories.


